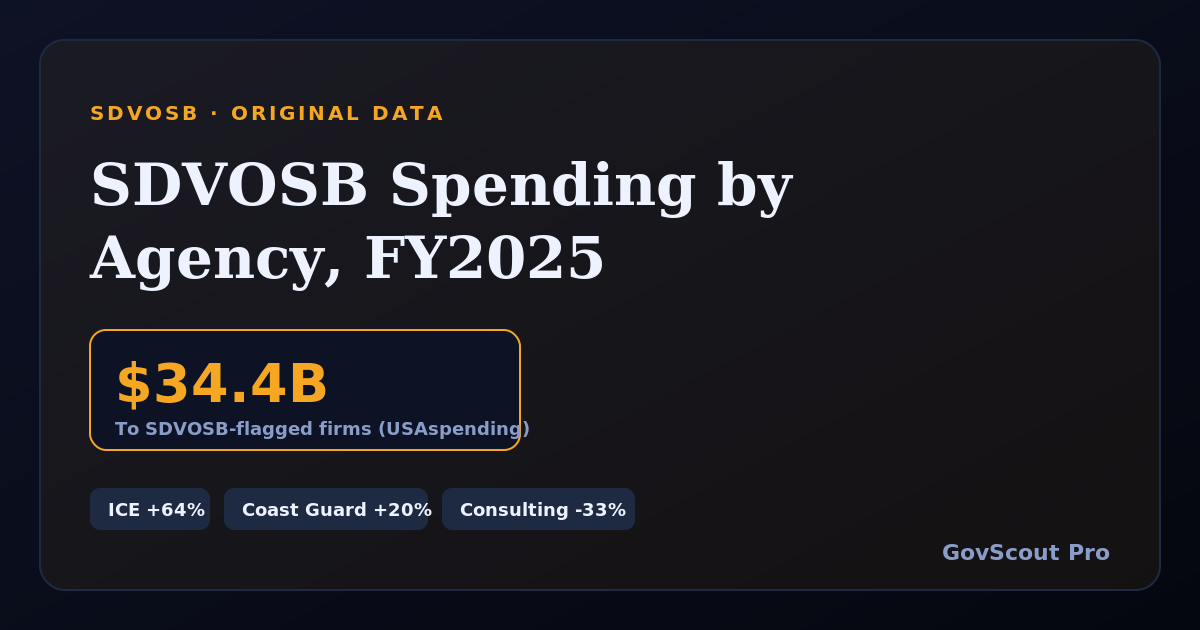
The headline: federal agencies obligated about $34.4 billion on contracts with SDVOSB-flagged companies in fiscal 2025, down slightly from $34.9 billion in FY2024 (-1.6%). That's flat. But the agency-level picture moved a lot, and that's where small veteran-owned firms should be aiming.
Download the agency data (CSV). It's free to use with credit to GovScout Pro.
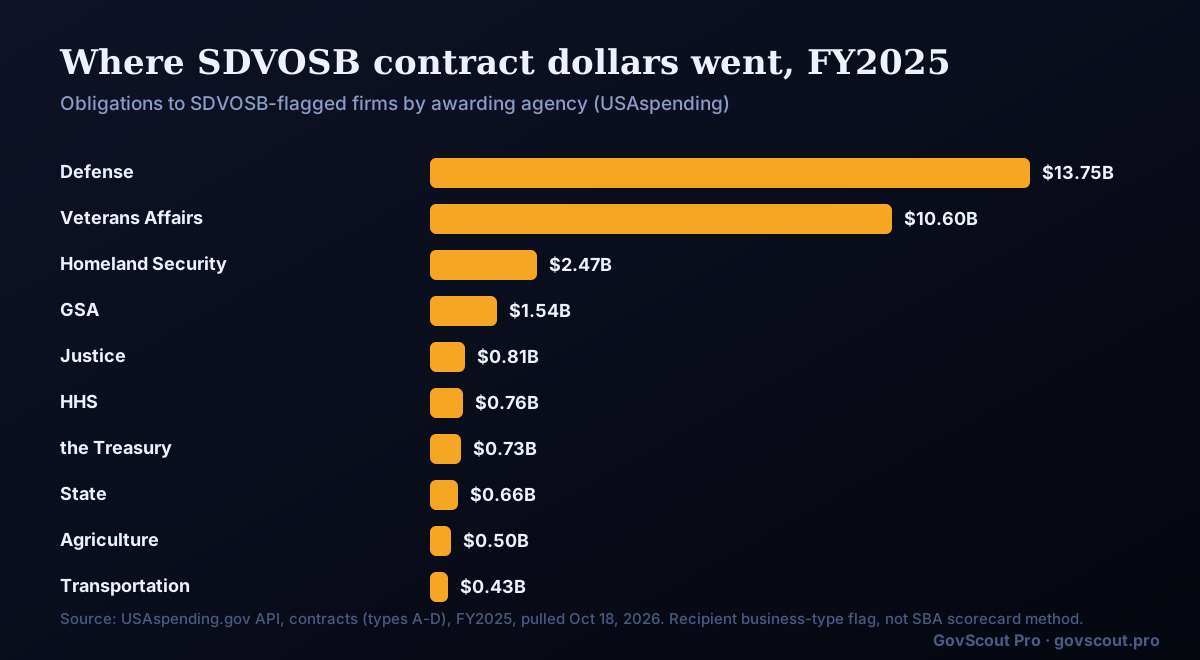
SDVOSB Dollars by Agency
| Agency | FY2025 | Share of agency contract dollars | Change vs FY2024 |
|---|---|---|---|
| Department of Defense | $13.75B | 2.8% | +2.3% |
| Department of Veterans Affairs | $10.60B | 13.5% | -3.4% |
| Department of Homeland Security | $2.47B | 8.7% | +14.2% |
| General Services Administration | $1.54B | 6.4% | +13.2% |
| Department of Justice | $0.81B | 9.5% | -3.6% |
| Department of Health and Human Services | $0.76B | 3.6% | -26.5% |
| Department of the Treasury | $0.73B | 8.6% | -2.1% |
| Department of State | $0.66B | 6.7% | -11.4% |
| Department of Agriculture | $0.50B | 5.3% | -16.0% |
| Department of Transportation | $0.43B | 4.7% | +4.5% |
| National Aeronautics and Space Administration | $0.43B | 2.7% | -2.3% |
| Department of Commerce | $0.32B | 7.6% | -22.2% |
The Buying Offices That Grew and Shrank
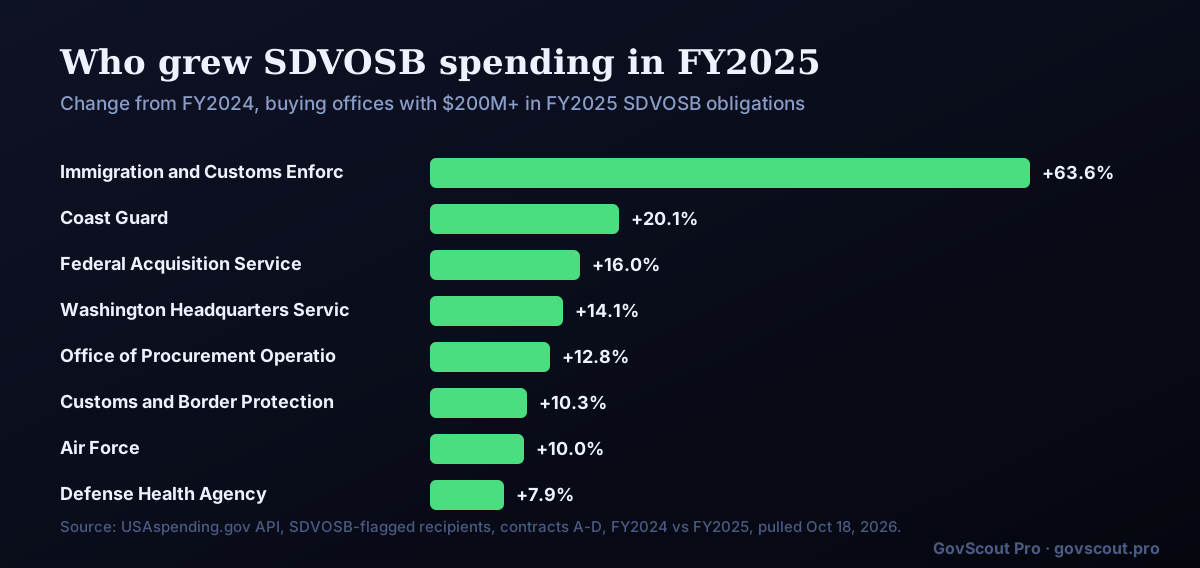
Department totals hide a lot. Here are the individual buying offices (sub-agencies) that spent the most with SDVOSBs in FY2025, with the change from FY2024.
| Buying office | FY2025 | Change vs FY2024 |
|---|---|---|
| Department of Veterans Affairs | $10.60B | -3.4% |
| Department of the Air Force | $3.55B | +10.0% |
| Department of the Navy | $3.43B | +0.3% |
| Department of the Army | $3.20B | -4.4% |
| Defense Logistics Agency | $1.46B | +5.0% |
| Federal Acquisition Service | $1.26B | +16.0% |
| U.S. Immigration and Customs Enforcement | $0.78B | +63.6% |
| Department of State | $0.66B | -11.4% |
| Defense Health Agency | $0.54B | +7.9% |
| U.S. Special Operations Command | $0.44B | -3.2% |
| Defense Information Systems Agency | $0.43B | -4.3% |
| U.S. Customs and Border Protection | $0.43B | +10.3% |
| National Aeronautics and Space Administration | $0.43B | -2.3% |
| Internal Revenue Service | $0.42B | -28.1% |
| Office of Procurement Operations | $0.37B | +12.8% |
| U.S. Coast Guard | $0.34B | +20.1% |
What SDVOSBs Got Paid to Do
| NAICS | Industry | FY2025 | Change vs FY2024 |
|---|---|---|---|
| 541519 | Other Computer Related Services | $6.57B | +2.3% |
| 236220 | Commercial and Institutional Building Construction | $3.91B | +6.6% |
| 541330 | Engineering Services | $2.99B | -6.5% |
| 541512 | Computer Systems Design Services | $2.69B | -19.4% |
| 541611 | Administrative Management and General Management Consulting Services | $1.35B | -32.9% |
| 488190 | Other Support Activities for Air Transportation | $1.03B | -0.1% |
| 541511 | Custom Computer Programming Services | $0.95B | -2.0% |
| 561210 | Facilities Support Services | $0.90B | +5.0% |
| 541715 | Research and Development in the Physical, Engineering, and Life Sciences (except Nanotechnology and Biotechnology) | $0.70B | +11.3% |
| 561599 | All Other Travel Arrangement and Reservation Services | $0.69B | +89.9% |
The shift matches the 2025 push across government to cut consulting and advisory contracts, while buildings, facilities, and hands-on work held up or grew. If your company sells management consulting, the SDVOSB set-aside alone won't carry you in 2026. Pair it with a specific, measurable service.
How Concentrated Is SDVOSB Money?
Very. The 10 largest SDVOSB recipients took about 18% of all FY2025 SDVOSB dollars, and the top 100 took about 43%. Big multi-year contracts and vehicles drive that. For a new firm, it means two things: the top 100 are your best teaming partners, and the remaining half of the money is spread across thousands of smaller awards where newcomers actually win.
Tips: How to Use This Data
- Follow growth, not size. An office that added 20% last year is looking for new vendors. One that cut 30% is protecting the ones it has.
- Cross-check your NAICS codes. If your main code shrank, look for a neighboring code where your work also fits and where spending grew.
- Call the top recipients in your field. They hold the big vehicles and need capable SDVOSB subs. Look them up on USAspending by your NAICS code.
- Check the share column. Agencies with a low SDVOSB share and a big budget are under pressure to raise it. That's an opening for a good sources sought response.
- Re-run it every year. USAspending is free. Search your NAICS code, filter recipient type to service-disabled veteran-owned, and compare years.
How We Got These Numbers
We used the public USAspending.gov API on October 18, 2026. Filters: fiscal year 2025 (October 1, 2024 to September 30, 2025) versus fiscal year 2024; contract award types A through D (definitive contracts, purchase orders, delivery orders, BPA calls); recipient business type "service-disabled veteran-owned business." Amounts are net obligations, so they include de-obligations.
This is not SBA's scorecard method. SBA counts only certified firms and only "eligible" dollars, which is why SBA reports $32.5 billion (5.01%) for FY2025 and we show $34.4 billion. USAspending data also changes as agencies correct records, so a later pull may differ slightly. Use these numbers for direction and targeting, not for official goal reporting.
Frequently Asked Questions
How much did the government spend with SDVOSBs in FY2025?
SBA's official scorecard reports $32.5 billion in prime contracts, or 5.01% of eligible dollars. Our USAspending pull of all obligations to SDVOSB-flagged firms shows about $34.4 billion.
Which agency spends the most with SDVOSBs?
The Department of Defense in total dollars, about $13.75 billion in FY2025, followed by Veterans Affairs at about $10.6 billion.
Which agencies grew SDVOSB spending in 2025?
Among large buyers, Immigration and Customs Enforcement (+64%), the Coast Guard (+20%), GSA's Federal Acquisition Service (+16%), and the Air Force (+10%) grew the most.
Can I use this data?
Yes. Download the CSV and use it with credit to GovScout Pro and a link to this page.